Combatting the Urban Heat Island Effect with UAV Thermal Imaging – Part 2
In Part 1 of this series we documented the severity of the urban heat island effect, outlined the streetscape pilot project conducted by SmithGroup for the thermal UAV study that is central to this story, and shared interesting results from preliminary training. In Part 2, we will cover how the urban canyon was successfully captured from the sky.
Just joining the conversation? The following link is a great place to start: Part 1.
AGENCY COORDINATION - HOW TO FLY UAVs IN THE URBAN ENVIRONMENT
A great deal of agency coordination, approvals and staging were required to fly the target corridor. The Huron streetscape project was technically a Michigan Department of Transportation (MDOT) right-of-way (ROW), while the city of Ann Arbor is situated under FAA Class D controlled airspace. Making this situation more complex, I intended to launch the UAV within a dense urban environment, and the ideal centrally-located launch location appeared to be from the greenroof on top of City Hall.
Working directly with the City of Ann Arbor, city leadership and staff coordinated all necessary municipal departments - including police, fire and safety, among others - to work with me across an entire week of weather-dependent thermal UAV scans. Airspace clearance was obtained from the FAA for each flight, and MDOT’s specialized UAV unit was responsive and direct about any concerns. The mission would not have been possible were it not for the amenable nature of each of these agencies. Proactive coordination with each entity months in advance proved invaluable to making the mission possible.
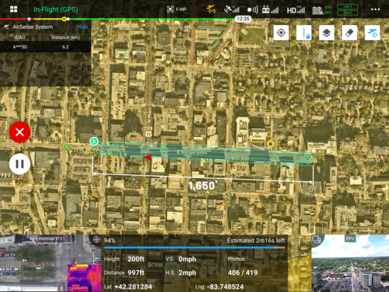
The final flight path for the Huron streetscape project measured approximately 1,650-feet long and required four parallel passes to effectively generate a thermal 3D model. I preset the flight path and altitude to safely travel about 50-feet higher than the tallest structure in the immediate corridor, which equated to an altitude of 200-feet above ground level (AGL). The UAV would travel at a slow crawl of 2mph and capture more than 400 overlapping hi-res thermal images.
PROCESSING UAV THERMAL IMAGING AND PHOTOGRAMMETRY
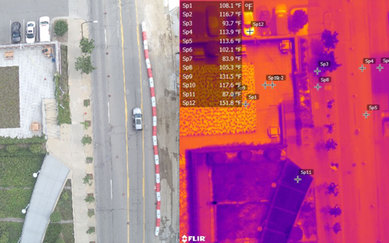
A variety of software was used to breakdown raw flight data. FLIR Tools brought the data to life at the micro scale, image by image. While FLIR Tools can immediately analyze thermal images with great accuracy, it also allows the user to toggle for material emissivity and further magnify the accuracy of data points. This type of granular assessment provided a great opportunity to take spot temperatures of very specific facets of the urban environment.
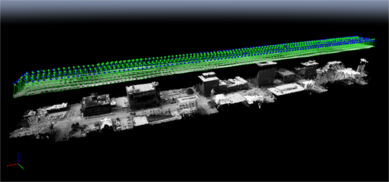
Thermal imaging was processed in Pix4D. Pix4D generated point clouds and georeferenced orthomosaics to analyze the entire corridor at the macro scale. Its toggleable data classification and visualization capabilities allow for quick takeoffs in terms of temperature by surface area that are critical for comparing pre- vs post-installation scans, and for identifying trends in the heat island’s response to urban design.

I benchmarked Pix4D temperature classes uniformly across each scan, with a standardized minimum and maximum temperature range for consistency between comparative visualizations. The thermal color divisions span approximately 50°F - 150°F, which is the visual temperature spectrum observed across all of the thermal orthomosaics. It is worth noting that surface temperatures measured considerably hotter than 150°F, and some of these areas have been identified in the enlargement.
This is the second installment of what will continue to unfold as data and forthcoming analyses reveal more. The next installment in this Perspectives series will temporally sculpt the ‘shape’ of a day in the urban heat island effect. Want to see more? Follow SmithGroup on LinkedIn and Twitter to be part of the conversation.